August 1, 2025
A guide to market sizing

Executive Summary
In a fast-changing world where technology is reshaping entire industries, market sizing has become an essential tool for anyone making strategic decisions.
This guide offers a structured, practical approach to market sizing, rooted in the proven frameworks and methodologies used by top consulting firms, and designed to be applied by teams across all sectors.
At its core, market sizing answers the deceptively simple question: How big is the opportunity? But done well, it goes far beyond that. It segments the landscape, forecasts growth, and pressure-tests assumptions, ensuring strategic clarity in even the most dynamic markets.
The guide covers:
TAM, SAM, SOM frameworks to distinguish potential vs. reality vs. near-term opportunity
Value driver trees to structure assumptions and support dynamic scenario modelling
Top-down vs. bottom-up methods, and demand-side vs. supply-side perspectives
Baseline and forecast modelling, using trends and growth drivers
Scenario planning to stress-test market views and inform strategy under uncertainty
Through real-world lessons, the guide highlights why structure, transparency, and thoughtful methodology matter.
E-mail any questions about this report or queries on how to work with Aqmen to questions@aqmen.ai or go to www.aqmen.ai to learn more.
Context Setting
In today’s fast-moving business environment—where technology, regulation, and customer behavior evolve rapidly—market sizing has become essential to sound decision-making. Whether you're buying a company, launching a product, entering a new market, or allocating strategic resources, understanding the size and structure of the opportunity is critical.
Consulting firms have long treated market sizing as a core discipline. It’s a cornerstone of commercial due diligence and strategic planning, sitting alongside competitive landscape and company analysis. For consultants, it’s not just a task—it’s a craft. Their structured, data-backed approach is designed to cut through uncertainty, reveal true potential, and often provide the edge needed to move first—or avoid costly missteps.
This guide captures that approach. Rooted in consulting best practices, it provides a clear and repeatable methodology that anyone—consultant or not—can apply to build credible, decision-ready market sizing. Because when decisions are made without it, they’re often based on intuitions, not facts.

Why Market Sizing is a Strategic Necessity
In both due diligence and broader strategy work, one of the most common questions business leaders are asked is deceptively simple:How big is the opportunity?
Market sizing provides the structured, evidence-based foundation needed to answer. At its core, it allows us to:
Quantify the true scale and structure of a market
Segment the landscape to highlight where to compete (and where not to!)
Forecast growth and identify the key drivers shaping market dynamics
Inform investment strategy and go/no-go acquisition decisions
Without this foundation, decision-making becomes speculative. With it, we better understand where value can be created and how best to position a company to capture it.
When Market Sizing Goes Wrong:
A lesson from AT&T and McKinsey
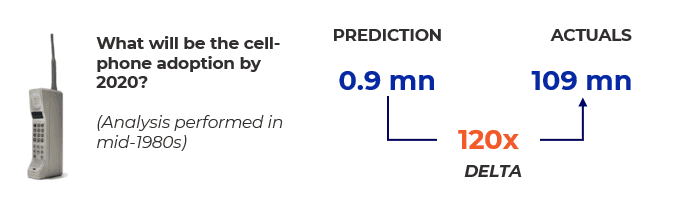
Even the most experienced teams can miss the mark. A well-known example comes from the early 1980s, when McKinsey was hired by AT&T to forecast the future of the mobile phone market.
Their estimate? Fewer than 1 million users in the US by the year 2000.
The reality? Almost 110 million mobile users.
The implications were huge! AT&T delayed investing in mobile, costing it a foothold in one of the biggest technology markets of the century.
So, what went wrong?
Primarily, the assumptions, especially around penetration. McKinsey focused on business users and underestimated how much demand would grow as devices became cheaper and more accessible. They missed the broader use cases and the speed of technological change.
This example shows just how important it is to structure your sizing, challenge your inputs, and think beyond what’s immediately visible, especially in fast-changing markets. With technologies like AI, clean energy, and biotech, rewriting the rules across industries today, disruption isn’t a possibility—it’s a given. Just like mobile phones moved from luxury to necessity in a matter of a few years, today’s breakthroughs could turn small markets into massive ones. A structured, dynamic sizing approach helps you stay ahead of the curve, pressure-test your assumptions, and give clients a clearer view of where the market could really go.
Fig.1: McKinsey’s cell-phone adoption estimates
TAM, SAM, SOM:
The Building Blocks of Market Sizing
When evaluating a market, strategists often break it down into three layers: TAM, SAM, and SOM. Each layer refines our understanding of the opportunity:
TAM: Total Addressable Market
TAM is a theoretical figure that represents 100% penetration within a clearly defined scope. In other words, it reflects the total demand if every potential customer adopted the product or service, regardless of current limitations such as access, competition, or adoption barriers. While aspirational, TAM sets the upper boundary of what’s possible, acting as a benchmark for long-term potential rather than short-term outcomes. It’s especially useful for highlighting whitespace in the market and estimating the upside that could be unlocked through increased penetration over time.
In the AT&T example, TAM would be everyone who could own a mobile phone, for example, the total global population aged 16-80.
SAM: Serviceable Addressable Market
SAM is the actual market. It’s the slice of TAM that reflects what’s really happening, who’s buying today and how widely the product is adopted. Unlike TAM, which is theoretical, SAM is grounded in reality. It represents the part of the market that a business could go after right now, based on current demand and adoption. Because of this, SAM is also the metric you’d typically use to calculate a company’s market share. It brings focus to your sizing by showing what’s genuinely addressable today, not just what’s possible in the future.
For AT&T’s, SAM would represent people globally who had already adopted mobile phones at the time of the analysis.
SOM: Serviceable Obtainable Market
SOM is the portion of SAM that a company can realistically capture in the near term. It reflects what’s achievable based on your current go-to-market strategy, brand reach, distribution channels, and competitive dynamics.
In AT&T’s case, SOM would represent actual mobile phone users in the US at the time.
Summary: TAM, SAM, SOM
TAM = A theoretical measurement that represents the full potential (all customers with full adoption)
SAM = The actual market (what’s realistically addressable considering real-world adoption and penetration)
SOM = Immediate opportunity (what you can actually win)

Understanding the distinction between TAM, SAM, and SOM is especially important in due diligence, where clients want to know both how large the opportunity could be and what is realistically within reach. Crucially, the gap between TAM and SAM—often referred to as whitespace—highlights the room a market has to grow. This is the headroom where strategic investments, improved access, or shifting behaviours can unlock significant upside.
In McKinsey’s case, they treated a disruptive market as if it would grow linearly, when in reality, mobile technology was on the cusp of exponential change. As a result, they underestimated how quickly the whitespace would be captured and how fast adoption would accelerate.
Level | Definition | Purpose | How It’s Calculated |
TAM | The total potential demand if every possible customer adopted the product—assuming 100% penetration. | Theoretical figure that sets the upper boundary of market potential; helps identify long-term opportunity and whitespace. | Total potential customers × full penetration rate × value per customer. |
SAM | The portion of TAM that reflects current, real-world adoption—customers who are actually buying today. | Represents the actual market that a business could go after right now, based on current demand and adoption. | Filtered TAM based on current penetration. |
SOM | The share of SAM that a business can realistically capture in the near term based on current capabilities. | Identifies the short-term sales opportunity. | SAM × estimated share based on GTM and brand reach based on current capabilities |
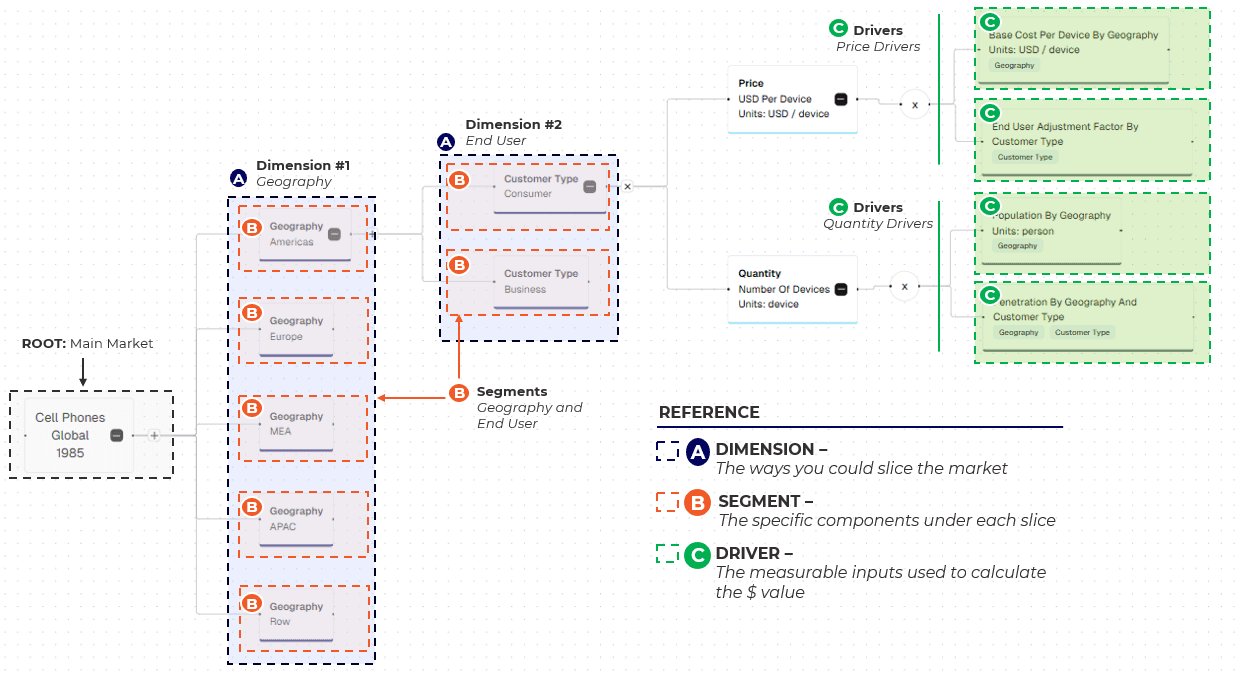
Using a Value Driver Tree to Structure the Market
Understanding TAM, SAM, and SOM gives us a high-level view of the opportunity—the “what” of market sizing. But how do we actually arrive at those numbers in a structured, defensible way? This is where the value driver tree comes in—the “how” behind the sizing.
A value driver tree is the analytical backbone of any robust market sizing exercise. It helps break down a market into its core components in a way that’s both visual and logical. It ensures all assumptions are explicit, avoids double-counting, and enables fast, flexible scenario planning.
Here’s how it works:
Dimensions are the high-level categories along which the market is broken down. It defines a key attribute used to structure the market, such as geography, customer segment, product category, or distribution channel.
Segments are the distinct alternatives within each dimension. For example, if "Geography" is a dimension, segments might include "North America," "Europe," and "Asia."
Drivers are the variables used to estimate price or quantity for each market segment. Numeric assumptions applied to each segment to calculate market size. Common drivers include number of customers, penetration rate, average selling price and consumption per user.
Drivers help estimate the value of each segment across your defined dimensions—like region, channel, or customer type. Add up the values of all segments, and you have your total market size
Fig.2: Value Driver Tree Sample: Cell Phones Global Market
Example: If we were sizing the smartphone market:
Dimensions might include geography (US, Europe, Asia) and customer type (Consumer, Business)
Segments would be each geography / customer type combination (e.g. US/Consumer, Europe/Consumer, etc.)
Drivers could include population, mobile penetration rate, and average spend per user
Change any driver— for example, increasing the smartphone penetration rate in Asia based on a trend of cheaper devices—and the model updates immediately.
That’s the power of the value driver tree: you can play with different assumptions and instantly see how the market size changes. These assumptions are anchored on underlying drivers of growth where data is generally available (or can be estimated) at the most granular level.
This method is widely used across consulting and strategy work because it creates a clear and auditable link between assumptions and results.
It’s also how Aqmen’s AI solution, Lio, works: you define your dimensions and segments, and Lio helps suggest the right drivers and even starting values. It forces you to get clear on what drives the market—and sets you up to move quickly into sizing and scenario planning with confidence.
Market Sizing Methodology
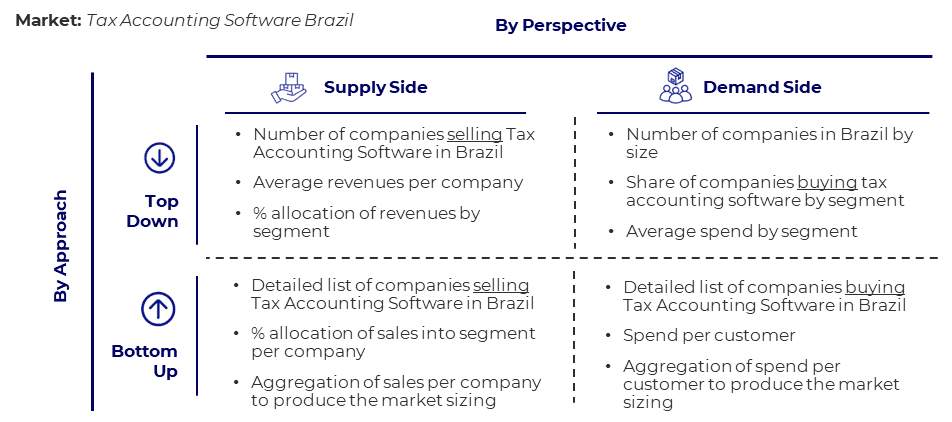
Approach and Perspective
Before building your value driver tree, it’s critical to define your sizing methodology. Whether you take a top-down or bottom-up approach—and view the market from the demand or supply side—will shape how the tree is structured and what data you’ll need.
Broadly, market sizing can be approached from two angles:
Top-Down vs. Bottom-Up (your method)
Demand-Side vs. Supply-Side (your perspective)
Combining these gives you four possible approaches, often visualized as a 2×2 matrix (Approach × Perspective), each approach offering benefits and potential blind spots.
Top-Down vs. Bottom-Up
Top-Down sizing begins with a broad total—such as an industry’s total revenue from existing reports —and applies filters to narrow it down. It’s quick and efficient when macro data is available, but it risks glossing over segment-level dynamics.
Bottom-Up sizing starts from granular data—e.g., number of customers per segment multiplied by average spend—and builds up. It’s more accurate and reflective of market reality but can be time-consuming and data-intensive.
Demand-Side vs. Supply-Side
Demand-Side focuses on customer behaviour: what they buy, how many, how often. This is intuitive for consumer and fragmented B2B markets.
Supply-Side looks at vendor sales, which is what is produced and sold. This works well in concentrated or mature markets.
Best Practice: Combine Methods
No method is perfect. The best results often come from triangulating multiple approaches. If bottom-up and top-down results align, that’s a sign of robustness. If they don’t, interrogate the assumptions—there may be hidden risks or overlooked opportunities.
Documenting which methodology you used, and why, builds confidence with stakeholders and strengthens your recommendations.
Fig. 3: Market Sizing Methodology Matrix: Sample Tax Accounting Market
From Baseline to Forecast
Modelling Growth
With your methodology chosen, the next step is to define the baseline and project forward to understand how the market might evolve over time. This is where market sizing shifts from being a static snapshot to becoming a dynamic strategic tool.
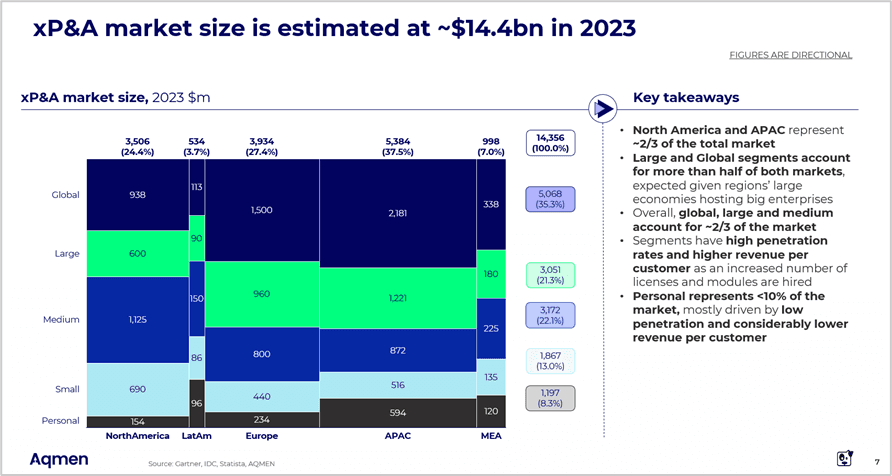
Establishing a Baseline
The baseline is your starting point—typically the current size of the market or the most recent (SAM), reliable data available. It anchors your model and shapes how credible and useful your forecast will be.
To define it:
Start with the best available data—from market reports, government statistics, trade associations, or internal company data.
If data is limited, use your value driver tree. Populate current estimates for drivers like customer count, penetration, and average spend.
Document your assumptions clearly. If you estimate 30% of mid-sized firms use a particular software, show how you arrived there (e.g. survey, proxy data, expert input).
Your goal is to establish a clear and defensible figure that represents the size of the market today (or in a recent year) within your defined scope.
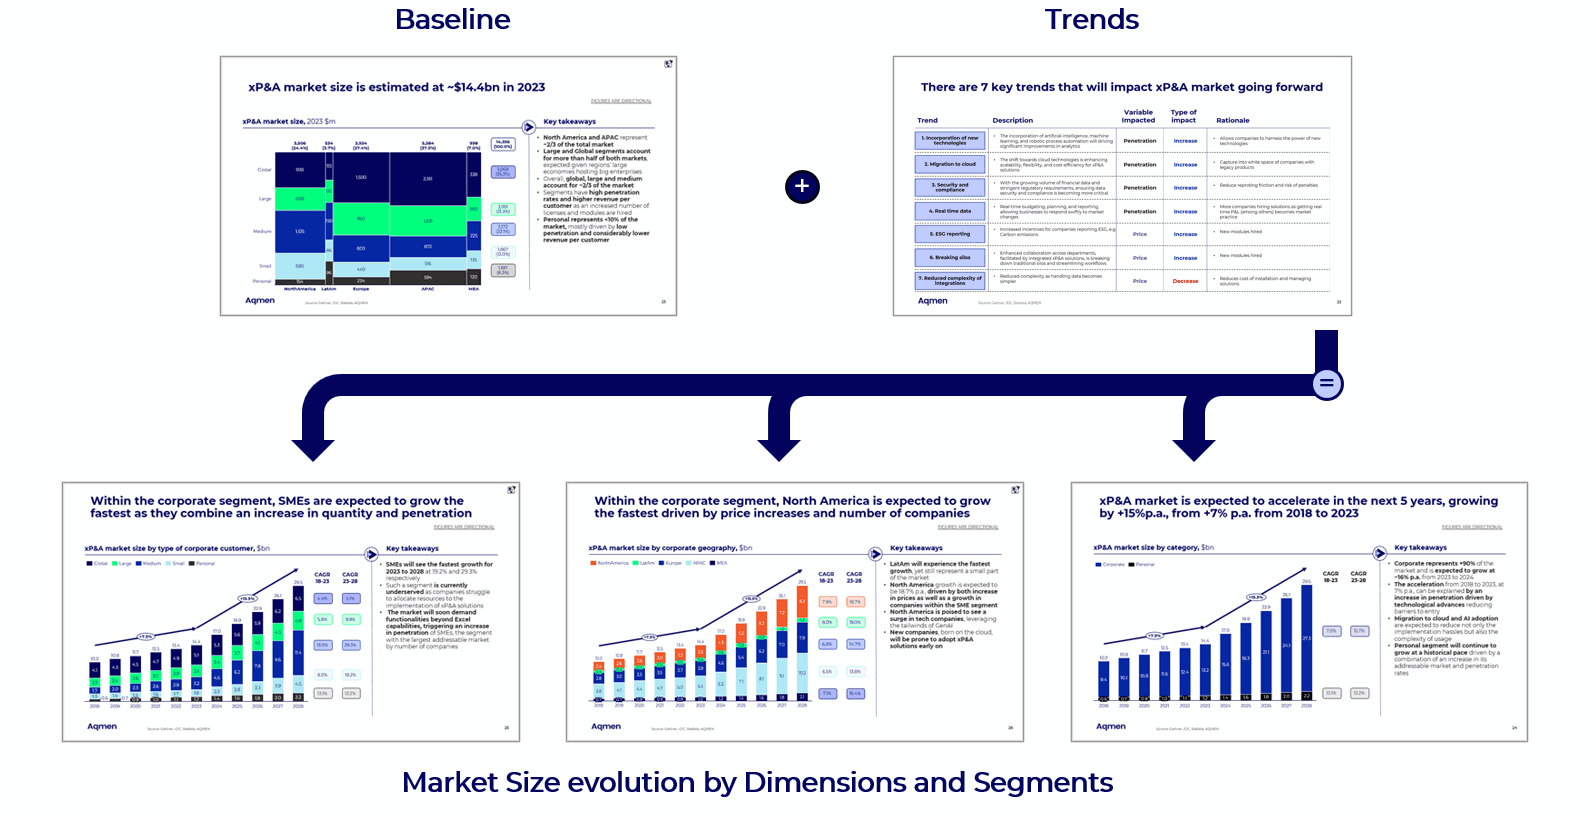
Fig. 4: Sample: Baseline overview – xP&A Market
Mekko charts are a common tool used by consultants to illustrate base year market size, as they provide a clear visual representation of Segment relevance across two combined Dimensions
Growth Drivers and Trends
Markets evolve. Identifying relevant trends—whether regulatory, demographic, technological, or economic—adds important context to your analysis and helps anticipate future shifts. Once the baseline is in place, the next step is to look ahead and consider the forces that could expand, contract, or reshape the market over time.
These often include:
Population or user base growth
Adoption or penetration increases (e.g. digital transformation, regulation)
Spending power or economic growth
Technology advancements (e.g. affordability, accessibility)
Regulatory shifts
Competitive activity (e.g. pricing dynamics, new entrants)
Use these to apply trend projections to the relevant parts of your driver tree. For example, if current adoption is 25% and cloud access is improving, you might model 50% adoption in five years.
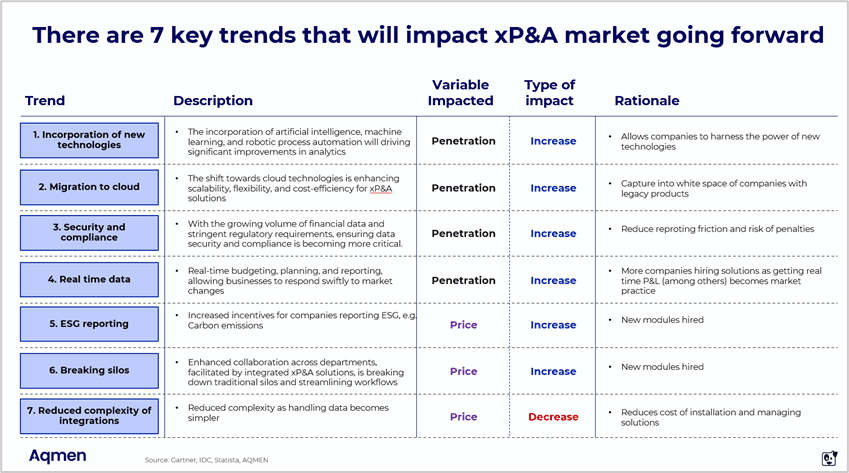
Fig. 5: Sample: Trends – xP&A Market
Trends tables are commonly used to identify and explain the forces shaping future market evolution. They help link qualitative insights to specific impact on drivers, while clarifying direction and rationale.
Scenario Planning:
Base, Bull, and Bear Cases
To make your model robust, build in flexibility. Create three scenarios:
Base Case: The most likely outcome based on current evidence and trends.
Bull Case: An optimistic scenario, e.g. tech adoption outpaces expectations.
Bear Case: A cautious view, e.g. growth is slower due to macroeconomic constraints.
Each scenario modifies the assumptions in your driver tree, such as higher or lower penetration, pricing shifts, or regulatory changes.
The Value of Flexibility
Having a dynamic, structured model means these scenarios are quick to run and easy to interpret. More importantly, they show which assumptions matter most (often shown as sensitivity analysis / tornado charts) —allowing teams to focus validation efforts where it counts or prepare strategies to influence key drivers.
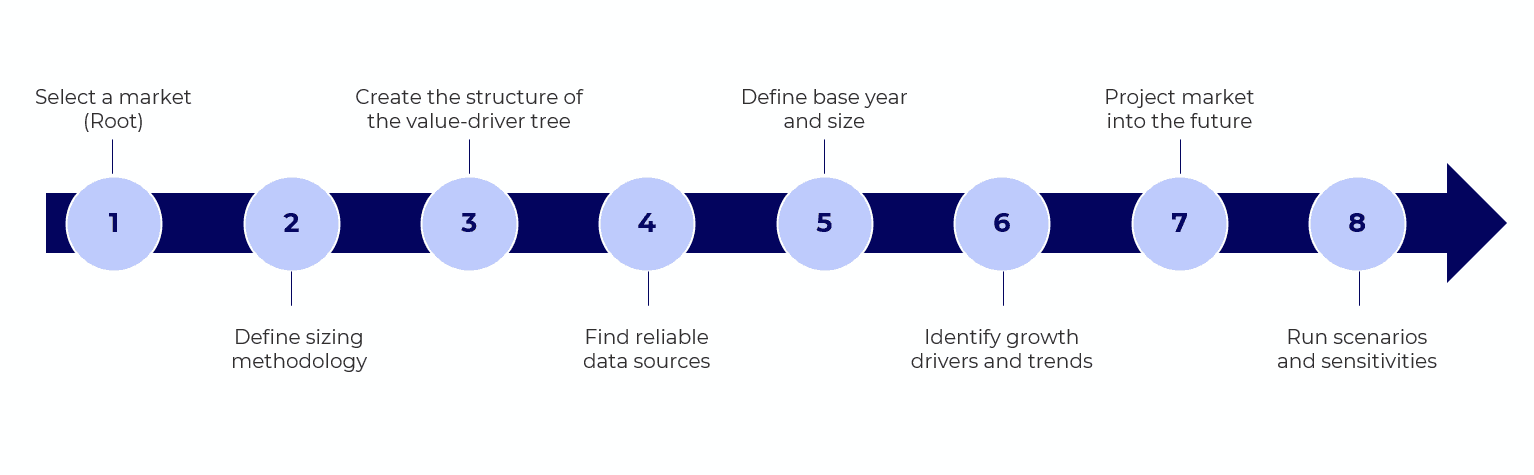
Fig. 6: Sample: Market Sizing - Overview of Stages and Outputs
Recap
Turning Market Sizing into a Strategic Superpower
Market sizing isn’t just about crunching a number—it’s about building a flexible, well-structured model that helps you (and your clients) make smarter decisions. It's an analysis anchored on real drivers of a business that you can understand how it evolves based on real data. When markets move quickly, it’s clarity and focus that give you the edge.
Here’s what to keep in mind:
Start with Structure and Methodology
Before you get into the numbers, get your market definition right—and build a value driver tree to map it out. Define your dimensions, segments, and drivers clearly. This upfront work pays off: it gives you a clear view of what’s driving your model and allows you to make faster adjustments when you start running scenarios. Remember, how you size the market is just as important as the number you land on, so it’s critical to get your methodology right from the start. Top-down is fast and useful for checking your logic, but bottom-up gives you the detail and nuance. A demand-side view keeps you focused on what customers actually want, while a supply-side lens reflects your competition in the market. Keeping your view too narrow with a top-down supply-side approach can cause you to miss the real opportunity. The fix? Combine methods. Compare perspectives. Challenge your assumptions.
TAM, SAM, SOM – Know Your Layers
Don’t stop at just one number. TAM shows the full potential. SAM narrows it down to the part of the market that’s relevant for your client. SOM zooms in on what’s realistically within reach. Each plays a role: TAM inspires, SAM informs, SOM targets. Together, they give you a balanced view of the opportunity—big picture and actionable.
Use the Data—Own the Assumptions
Use the best data available—but don’t let gaps hold you back. In emerging or fast-moving markets, some level of assumption is inevitable. The important part is making sure those assumptions are well-reasoned and clearly documented. Remember, a good market sizing model is dynamic. Keep refining it as new data becomes available. That’s how you maintain credibility—and ensure your insights stay relevant.
Model the Possibilities
No one can predict the future perfectly—but you can plan for it. A strong model lets you run what-if scenarios: What if adoption takes off? What if a new player enters? What if prices drop? These aren’t just hypotheticals—they’re tools to help your client see the road ahead more clearly. Fast, credible scenario planning is what separates good teams from great ones.
Fig. 7: Market Sizing: Step-by-Step overview
Looking Ahead
Done right, market sizing is more than just a model—it’s a mindset. It brings structure to strategy and clarity to complex questions. Most importantly, it helps clients move forward with confidence—and shows that you’re not just asking smart questions, but bringing real answers to the table.
In today’s volatile markets, that kind of clarity is a serious advantage.
So whether you’re scoping a new opportunity or advising on a major deal, take the time to build a thoughtful, flexible market sizing. It won’t just impress stakeholders—it’ll help you shape strategy that holds up in the real world.
If you'd like support applying this approach, or using AI to speed up and scale your sizing work, we’d be glad to help.
About Aqmen AI
Aqmen is a productivity platform built by former consultants, for consultants, designed to accelerate and elevate commercial due diligence projects.
Powered by its proprietary AI agent Lio, Aqmen’s platform automates the analytical heavy lifting of commercial due diligence and strategy work. Think about market sizing, competitive landscape, and company assessments.
With Lio, teams can:
Build rigorous, transparent market sizing models in minutes
Generate structured analysis and scenario planning with precision
Automate repetitive research tasks to focus on strategic insight
By combining consulting-first design with cutting‑edge AI, Aqmen helps consulting companies streamline commercial due diligence processes and deliver insights confidently under tight timelines.
To explore a pilot or request a demo, visit aqmen.ai

Written by:

Miguel Casares
Co-founder and CEO
Share with friends:
Index